This grade 1 data test checks organizing and reading data in 45 minutes, with 8 questions for a total of 20 points.
This test has 8 short questions about tally charts, picture graphs, and bar graphs. It is worth 20 points and takes about 30 minutes. Read each graph carefully, then write your numbers.
- Grade: Grade 1
- Chapter: Organizing and Reading Data
- Common Core: 1.MD.C.4
- Time: 30 minutes
- Total: 20 points (Question 1: 2 pts; Question 2: 2 pts; Question 3: 3 pts; Question 4: 3 pts; Question 5: 2 pts; Question 6: 2 pts; Question 7: 2 pts; Question 8: 4 pts)
Grade 1 Data Test: questions 1–5
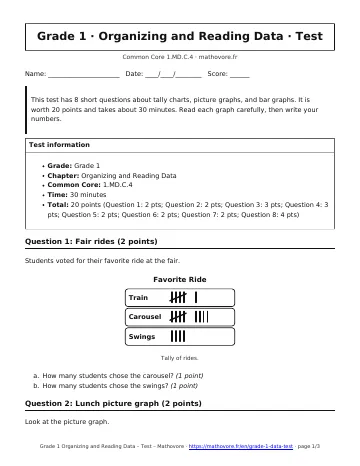
Question 1: Fair rides (2 points)
Students voted for their favorite ride at the fair.
- How many students chose the carousel? (1 point)
- How many students chose the swings? (1 point)
Question 2: Lunch picture graph (2 points)
Look at the picture graph.
- Which lunch has the most votes? (1 point)
- Which lunch has the fewest votes? (1 point)
Question 3: Recess bar graph (3 points)
Look at the bar graph.
- How many students chose tag? (1 point)
- How many more students chose tag than kickball? (1 point)
- How many fewer students chose jump rope than kickball? (1 point)
Question 4: Fruit votes (3 points)
Priya asked 9 friends to pick a fruit. The answers were: apple, grape, apple, banana, apple, banana, apple, banana, apple.
- Write how many friends chose each fruit: apple, banana, and grape. (2 points)
- Draw tally marks to show the number of friends who chose apple. (1 point)
Question 5: Pets in all (2 points)
A bar graph shows 7 votes for dogs, 5 votes for cats, and 3 votes for birds. How many votes are there in all?
Grade 1 Data Test: questions 6–8
Question 6: Marbles (2 points)
A picture graph shows 9 red marbles and 4 blue marbles. How many fewer blue marbles are there than red marbles?
Question 7: Same number (2 points)
A bar graph shows Soccer 6, Tennis 6, and Golf 2. Which two sports have the same number of votes? Write the number.
Question 8: Farmers market votes (4 points)
A tally chart shows what 20 shoppers bought: corn 7, peas 5, beans 8.
- How many shoppers bought corn, peas, or beans in all? (2 points)
- How many more shoppers bought corn than peas? (1 point)
- How many fewer shoppers bought peas than beans? (1 point)

How to use this grade 1 data test
Take this grade 1 data test without notes, then grade it with the test answer key out of 20 points.

See every chapter on the Grade 1 math page.